
Yoann Gut, Antoine Raguet, Les Laboratoires Servier, France
Introduction
we investigate whether the faster NIR-SRS technique can achieve predictive performance comparable to conventional FT-NIR, while meeting the stringent reliability requirements of pharmaceutical analysis.
Methods
Experimental design
- Tablets with 25% w/w API
- 3 hardness levels: 80N - 120N - 160N
- 5 levels of API content (% LC): 70% - 85% - 100% - 115% - 130%
- 15 batches x 55 tablets: 825 tablets
- Multi – day measurements (variability captured)
Workflow
- Tablets
- NIR-SRS | FT-NIR
- Preprocessing
- PLS models
- Validation
NIR - SRS
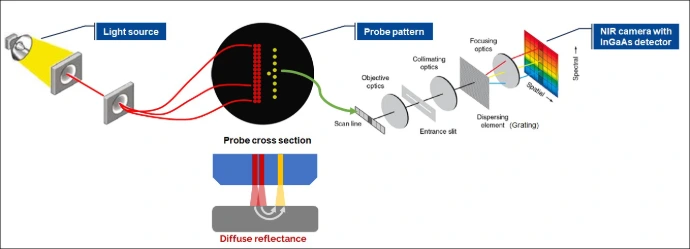
Spectral range: 950–1650 nm (10526–6060 cm-1)
- Calibration: 15 tablets/batch (675 spectra)
- Validation (test): 40 tablets/batch (1800 spectra)
FT - NIR
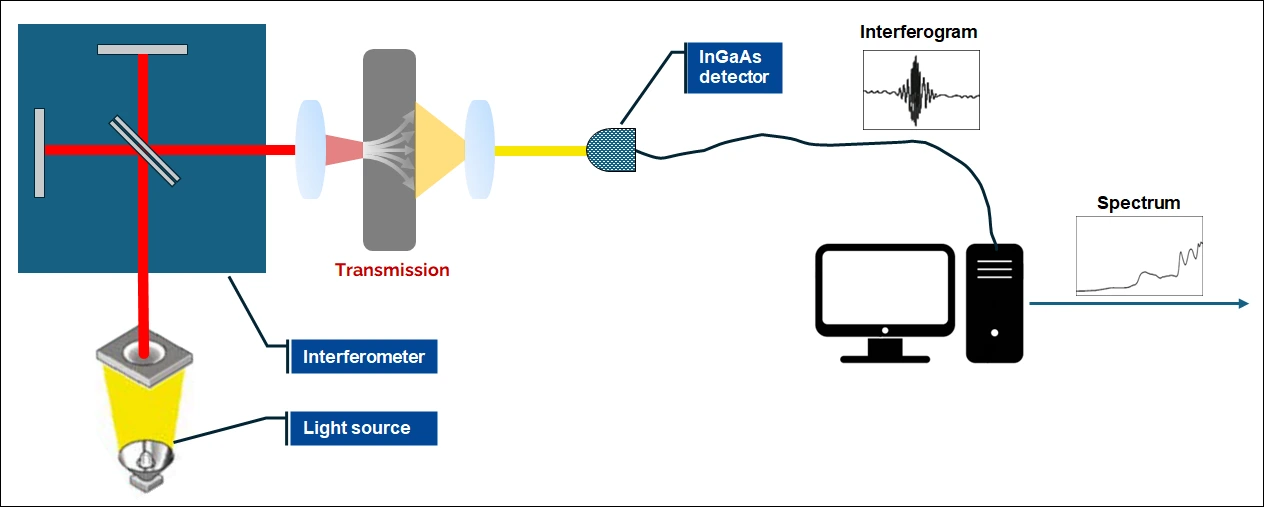
Spectral range: 11650–7050 cm-1 (858–11418 nm)
- Calibration: 15 tablets/batch (225 spectra)
- Validation (test): 40 tablets/batch (600 spectra)
NIR - SRS | Parameters | FT - NIR |
Wavelength [nm] | Measurement unit | Wavenumber [cm-1] |
900 – 1650 [nm] | Spectral range | 12800 – 5800 [cm-1] |
3x1 ms | Acquisition time | 32 scans (16 s) |
Diffuse reflectance | Mode | Transmission |
Results
In the absence of reference measurements, the nominal tablet strength (% LC) was used as the target variable for model development. Spectral preprocessing and multivariate modeling for both systems were performed using PLS_Toolbox (Eigenvector). Given the large number of available validation samples, a basic cross-validation approach was applied for both models (Venetian blinds, 10 splits, 1 sample/blind).
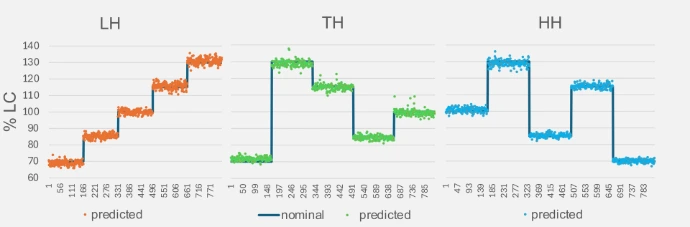
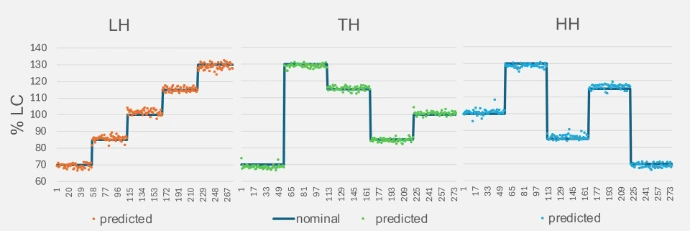
- Despite the pronounced influence of tablet hardness on the spectral response, predicted values from both techniques closely matched the nominal tablet strength (% LC).
- While different preprocessing strategies and model parameterizations were required - partly due to software constraints of the FT-NIR bench-top device - comparable predictive performance was obtained.
NIR - SRS
FT - NIR
NIR - SRS | FT - NIR | |
0.99 | R²C | 0.99 |
1.7 | RMSEC %LC | 1.5 |
1.8 | RMSECV %LC | 1.6 |
1.7 | RMSEP %LC | 1.7 |
4 | LV | 4 |
Conclusion
- Both FT-NIR and NIR-SRS achieved comparable accuracy and robustness in predicting API mass fractions in pharmaceutical tablets.
- While FT-NIR provided slightly more stable spectra due to controlled conditions, NIR-SRS matched its predictive performance while enabling significantly faster measurements and higher throughput.
- This makes NIR-SRS well suited for real-time or at-line quality control, reducing analysis time and supporting more efficient pharmaceutical manufacturing.
Feature | NIR - SRS | FT - NIR |
Accuracy | Excellent | Excellent |
Speed | Fast | Slow |
Throughput | High | Limited |
Robustness | Good | Good |